Note
Go to the end to download the full example code.
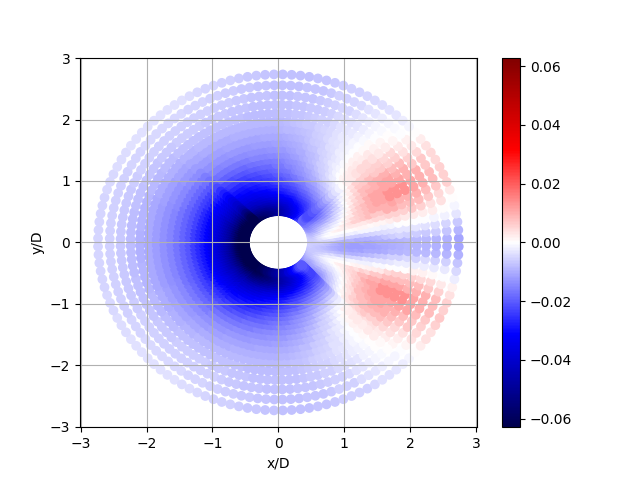
Plot bed interface from unstructured mesh
This example shows how to create a pointer list of profiles from an unstructured mesh and to extract the bed interface elevation. The results are plotted as a scatter plot.
#path where the simulation is located
path = '../../output_samples'
#Name of the simulation to load
simu = '3dscour'
#time step to load
timeStep = '0'
#Switch to save postprocessed data on output
saveOutput = 1
Read the mesh and extract the pointerList
import python packages
from fluidfoam import readmesh,readfield
import os
import numpy as np
#
#---read mesh (in folder constant, if not done type writeCellCenters -time constant in a terminal)
#
sol = os.path.join(path, simu)
Xb, Yb, Zb = readfield(sol, 'constant', 'C', precision=12)
#
#---create a list of (x,y) positions correpsonding to Zb = min(Zb)
#
print("Generate pointer list")
pbed = np.where(Zb == np.amin(Zb))[0]

n2d = np.size(pbed)
nz = 0
profileList = []
for i in range(n2d):
    #Extract the list of points having the same (Xb, Yb) values
    indices = np.where(np.logical_and(Xb == Xb[pbed[i]],
                                      Yb == Yb[pbed[i]]))[0]
    nz = max(nz, np.size(indices))
    profile = list(indices)
    #Sort the list of points by increasing Zb values (profile)
    profileSorted = [x for _, x in sorted(zip(Zb[profile], profile))]
    #Append the list to the profileList
    profileList.append(profileSorted)

# Convert profileList to numpy.array
pointer = np.array(profileList)
Reading file ../../output_samples/3dscour/constant/C
Generate pointer list
Extract bed surface from alpha.a profiles: min{ Zb | alpha.a <= 0.57 }
print("Extract bed surface")
a    = readfield(sol, timeStep, 'alpha.a')

zbed = np.zeros(n2d)
for i in range(n2d):
    bed_surface=np.where(a[pointer[i,:]] <= 0.57)[0]
    zbed[i] = np.min(Zb[pointer[i,bed_surface]])
Extract bed surface
Reading file ../../output_samples/3dscour/0/alpha.a
Now plot the zbed elevation
import matplotlib.pyplot as plt

D = 0.1
zmin = np.min([np.min(zbed), -np.max(zbed)])
zmax = np.max([-np.min(zbed), np.max(zbed)])
zlevels = np.linspace(zmin, zmax, 51)

plt.figure()
plt.scatter(Xb[pbed]/D, Yb[pbed]/D, c=zbed,
            vmin=zmin, vmax=zmax, cmap = 'seismic')
plt.colorbar()

#Setting axis labels
plt.xlabel('x/D')
plt.ylabel('y/D')

# add grid
plt.grid()

# show figure
plt.show()
save NetCDF files in constant and timeStep folders
if saveOutput == 1:
    from netCDF4 import Dataset

    postProcFile = os.path.join(sol, 'constant/pointerpostproc.nc')
    print ("save postprocFile in:",postProcFile)

    # NetCDF file creation
    rootgrp = Dataset(postProcFile, 'w')

    # Dimensions creation
    rootgrp.createDimension('XY', n2d)
    rootgrp.createDimension('Z', nz)

    # Variables creation
    pb_file = rootgrp.createVariable('pbed', np.int64, 'XY')
    x_file  = rootgrp.createVariable('x', np.float64, 'XY')
    y_file  = rootgrp.createVariable('y', np.float64, 'XY')
    z_file  = rootgrp.createVariable('z', np.float64, ('XY','Z'))
    p_file  = rootgrp.createVariable('p', np.int64, ('XY','Z'))

    # Writing variables
    pb_file[:]  = pbed
    x_file[:]   = Xb[pbed]
    y_file[:]   = Yb[pbed]
    z_file[:,:] = Zb[pointer[:,:]]
    p_file[:,:] = pointer[:,:]

    # File closing
    rootgrp.close()

    postProcFile2 = os.path.join(sol, timeStep, 'zbed.nc')
    print ("save zbed file in:",postProcFile2)

    # NetCDF file creation
    rootgrp = Dataset(postProcFile2, 'w')

    # Dimensions creation
    rootgrp.createDimension('XY', n2d)
    rootgrp.createDimension('Z', nz)

    # Variables creation
    zb_file = rootgrp.createVariable('zbed', np.float64, 'XY')

    # Writing variables
    zb_file[:]  = zbed

    # File closing
    rootgrp.close()
save postprocFile in: ../../output_samples/3dscour/constant/pointerpostproc.nc
save zbed file in: ../../output_samples/3dscour/0/zbed.nc
Total running time of the script: (0 minutes 7.671 seconds)