Note
Go to the end to download the full example code.
Time series of OpenFoam scalar field
This example reads and plots a time series of an OpenFoam scalar field
Gets the time directories
Note
Tries if directory is a number and adds it in the time array
import os
import numpy as np

sol = '../output_samples/box/'
dir_list = os.listdir(sol)
time_list = []

for directory in dir_list:
    try:
        float(directory)
        time_list.append(directory)
    except:
        pass
time_list.sort(key=float)
time_list=np.array(time_list)
Reads a scalar value at a given position for different times
Note
It reads the scalar field p at position 20 and stores it in the numpy array time_series
# import readvector function from fluidfoam package
from fluidfoam import readscalar

sol = '../output_samples/box/'

time_series = np.empty(0)

for timename in time_list:
    p = readscalar(sol, timename, 'p')
    time_series = np.append(time_series, p[20])
Reading file ../output_samples/box/0/p
Reading file ../output_samples/box/1/p
Reading file ../output_samples/box/2/p
Reading file ../output_samples/box/3/p
Reading file ../output_samples/box/4/p
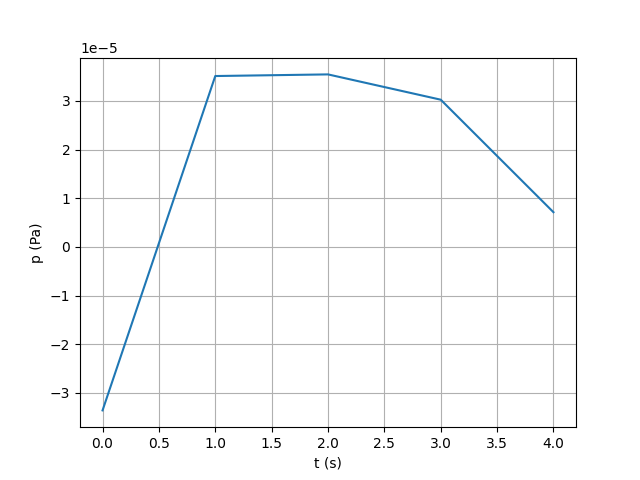
Now plots the time series
import matplotlib.pyplot as plt

plt.figure()

# Converts strings to float for plot
time_list = [float(i) for i in time_list]
plt.plot(time_list, time_series)

# Setting axis labels
plt.xlabel('t (s)')
plt.ylabel('p (Pa)')

# add grid
plt.grid()
Total running time of the script: (0 minutes 0.076 seconds)