Note
Go to the end to download the full example code.
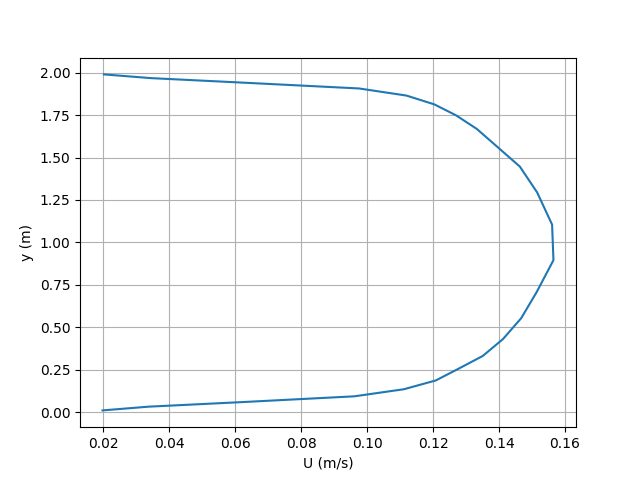
Spatially averaged profile
This example reads and plots a spatially averaged profile of the first component of an OpenFoam vector field from a structured mesh
First reads the mesh
Note
It reads the mesh coordinates for a structured mesh (argument True) and stores them in variables x, y and z
# import readmesh function from fluidfoam package
from fluidfoam import readmesh

sol = '../../output_samples/box/'

x, y, z = readmesh(sol, structured=True)
Reading file ../../output_samples/box//constant/polyMesh/owner
Reading file ../../output_samples/box//constant/polyMesh/faces
Reading file ../../output_samples/box//constant/polyMesh/points
Reading file ../../output_samples/box//constant/polyMesh/neighbour
Reads a vector field
Note
It reads a vector field from a structured mesh and stores it in vel variable
# import readvector function from fluidfoam package
from fluidfoam import readvector

timename = '0'
vel = readvector(sol, timename, 'U', structured=True)
Reading file ../../output_samples/box/0/U
Reading file ../../output_samples/box//constant/polyMesh/owner
Reading file ../../output_samples/box//constant/polyMesh/faces
Reading file ../../output_samples/box//constant/polyMesh/points
Reading file ../../output_samples/box//constant/polyMesh/neighbour
Averaging along x and z axis (1 and 3)
import numpy as np

vel_averaged = np.mean(np.mean(vel, 3), 1)
Now plots the profile of the averaged first velocity component
import matplotlib.pyplot as plt

plt.figure()
plt.plot(vel_averaged[0], y[0, :, 0])

#Setting axis labels
plt.xlabel('U (m/s)')
plt.ylabel('y (m)')

# add grid
plt.grid()
Total running time of the script: (0 minutes 1.114 seconds)