Note
Go to the end to download the full example code.
Contour from a slice in domain
This example reads and plots a contour of the first component of an OpenFoam vector field from a structured mesh
First reads the mesh and print the shape/size of the mesh
Note
It reads the mesh coordinates for a structured mesh (argument True) and stores them in variables x, y and z
# import readmesh function from fluidfoam package
from fluidfoam import readmesh

sol = '../../output_samples/box/'

x, y, z = readmesh(sol, structured=True)

nx, ny, nz = x.shape
print("Nx = ", nx, "Ny = ", ny, "Nz = ", nz)
Reading file ../../output_samples/box//constant/polyMesh/owner
Reading file ../../output_samples/box//constant/polyMesh/faces
Reading file ../../output_samples/box//constant/polyMesh/points
Reading file ../../output_samples/box//constant/polyMesh/neighbour
Nx =  20 Ny =  24 Nz =  15
Reads a vector field
Note
It reads a vector field from a structured mesh and stores it in vel variable
# import readvector function from fluidfoam package
from fluidfoam import readvector

timename = '0'
vel = readvector(sol, timename, 'U', structured=True)
Reading file ../../output_samples/box/0/U
Reading file ../../output_samples/box//constant/polyMesh/owner
Reading file ../../output_samples/box//constant/polyMesh/faces
Reading file ../../output_samples/box//constant/polyMesh/points
Reading file ../../output_samples/box//constant/polyMesh/neighbour
Now plots the contour of the first velocity component at a given z position
Note
Here the position z is the middle (// is used to have an integer)
import matplotlib.pyplot as plt
import numpy as np

plt.figure()
levels = np.arange(0, 0.178, 0.001)
plt.contourf(x[:, :, nz//2], y[:, :, nz//2], vel[0, :, :, nz//2],
             levels=levels)

# Setting axis labels
plt.xlabel('x (m)')
plt.ylabel('y (m)')
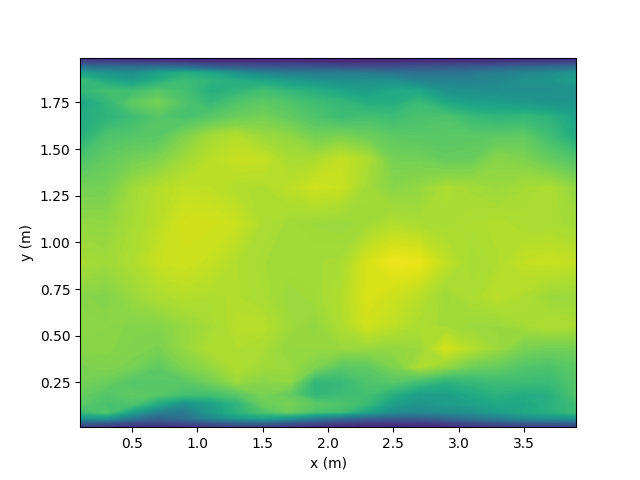
Text(33.972222222222214, 0.5, 'y (m)')
Now add on the same plot the velocity vectors
plt.figure()
plt.contourf(x[:, :, nz//2], y[:, :, nz//2], vel[0, :, :, nz//2],
             levels=levels)

# Setting axis labels
plt.xlabel('x (m)')
plt.ylabel('y (m)')

plt.quiver(x[:, :, nz//2], y[:, :, nz//2],
           vel[0, :, :, nz//2], vel[1, :, :, nz//2])
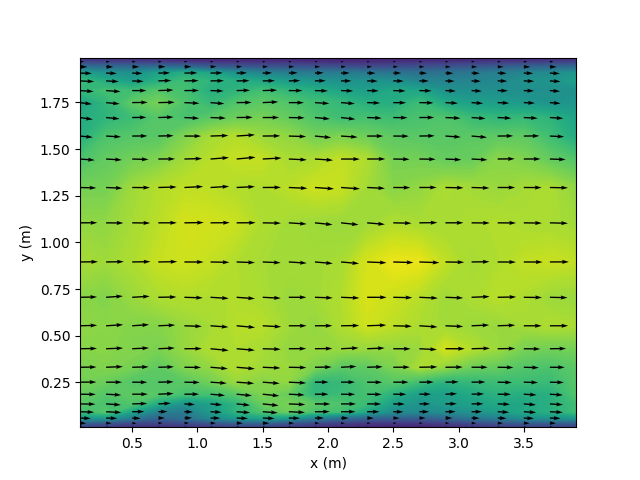
<matplotlib.quiver.Quiver object at 0x721831060050>
Total running time of the script: (0 minutes 1.228 seconds)