Note
Go to the end to download the full example code.
Contour and scatter from a boundary/patch
This example reads and plots the first component of an OpenFoam vector field from a boundary (patch) of a structured mesh
First reads the mesh and print the shape/size of the mesh boundary
Note
It reads the mesh coordinates of a boundary for a structured mesh and stores them in variables x, y and z
# import readmesh function from fluidfoam package
from fluidfoam import readmesh


sol = "../../output_samples/box/"

x, y, z = readmesh(path=sol, structured=True, boundary="topWall")

nface = x.shape
print("Boundary shape = ", nface)
Reading file ../../output_samples/box//constant/polyMesh/faces
Reading file ../../output_samples/box//constant/polyMesh/points
Reading file ../../output_samples/box//constant/polyMesh/boundary
Boundary shape =  (20, 1, 15)
Reads a vector field
Note
It reads a vector field of a boundary from a structured mesh and stores it in vel variable
# import readvector function from fluidfoam package
from fluidfoam import readvector

timename = "0"
vel = readvector(sol, timename, "U", structured=True, boundary="topWall")
Reading file ../../output_samples/box/0/U
Warning : No data on boundary/patch
Using the values of the nearest cells
Reading file ../../output_samples/box//constant/polyMesh/boundary
Reading file ../../output_samples/box//constant/polyMesh/owner
Reading file ../../output_samples/box//constant/polyMesh/faces
Reading file ../../output_samples/box//constant/polyMesh/points
Reading file ../../output_samples/box//constant/polyMesh/boundary
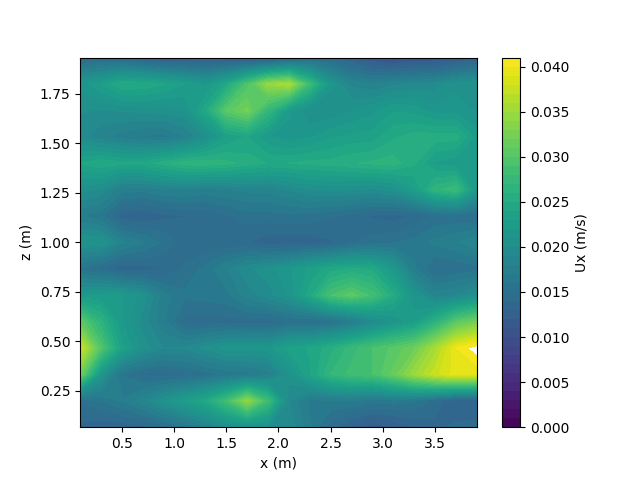
Now plots the contour of the first velocity component on the topWall boundary
Note
Here the topWall boundary is in (x, z) plane
import matplotlib.pyplot as plt
import numpy as np

plt.figure()

levels = np.arange(0, np.max(vel[0]), 0.001)
ax = plt.contourf(x[:, 0, :], z[:, 0, :], vel[0, :, 0, :], levels=levels)
cbar = plt.colorbar(ax)
cbar.set_label("Ux (m/s)")

# Setting axis labels
plt.xlabel("x (m)")
plt.ylabel("z (m)")
Text(33.972222222222214, 0.5, 'z (m)')
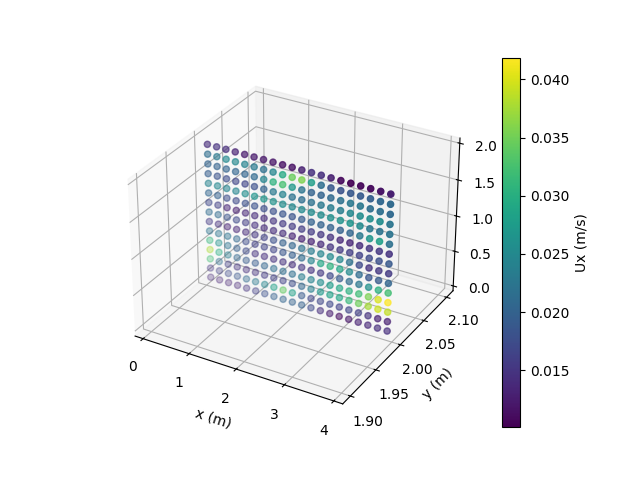
If you don’t know the plane
fig = plt.figure()
ax = fig.add_subplot(111, projection="3d")

ax3d = ax.scatter(x, y, z, c=vel[0, :, :, :])

# Setting axis labels
ax.set_xlabel("x (m)")
ax.set_ylabel("y (m)")
ax.set_zlabel("z (m)")
cbar = plt.colorbar(ax3d)
cbar.set_label("Ux (m/s)")
Total running time of the script: (0 minutes 0.402 seconds)