Note
Go to the end to download the full example code.
Get the cell centroids and cell volumes of a given box
This example shows how to extract the cell volumes inside a given box
First import the getVolumes function and other relevant libraries
#import the class MeshVisu, numpy library and getVolumes function
from fluidfoam import MeshVisu
from fluidfoam.readof import getVolumes
import numpy as np
# path to the simulation to load
path = '../../output_samples/pipeline'

# Load mesh and create an object called myMesh
# The box by default is equal to the mesh dimension
myMesh = MeshVisu( path =  path)
Reading file ../../output_samples/pipeline/constant/polyMesh/faces
Reading file ../../output_samples/pipeline/constant/polyMesh/points
Box set to mesh size:
 (minx, miny, minz) = (np.float64(-0.75), np.float64(-0.1), np.float64(-0.001))
 (maxx, maxy, maxz) = (np.float64(1.0), np.float64(0.205), np.float64(0.0))
We are going to extract the cell volumes and cell centroids of two given boxes
#tuple of box's dimension: ((xmin, ymin, zmin), (xmax, ymax, zmax))
mybox_A = ((0, 0, -1), (0.03, 0.03, 1))
mybox_B = ((0.022, 0.0221, -1), (0.0274, 0.0275, 1))

#getVolumes function returns arrays containing the centroids and volume of the
#cells inside boxes A and B
centroidList_box_A,vol_box_A = getVolumes( path =  path, box = mybox_A)
centroidList_box_B,vol_box_B = getVolumes( path =  path, box = mybox_B)

vol_box_A_total = sum(vol_box_A)
vol_box_B_total = sum(vol_box_B)

print("Total cell volume inside the box A:", vol_box_A_total)
print("Total cell volume  inside the box B:", vol_box_B_total)
Reading file ../../output_samples/pipeline/constant/polyMesh/owner
Reading file ../../output_samples/pipeline/constant/polyMesh/faces
Reading file ../../output_samples/pipeline/constant/polyMesh/points
Reading file ../../output_samples/pipeline/constant/polyMesh/neighbour
Reading file ../../output_samples/pipeline/constant/polyMesh/owner
Reading file ../../output_samples/pipeline/constant/polyMesh/faces
Reading file ../../output_samples/pipeline/constant/polyMesh/points
Reading file ../../output_samples/pipeline/constant/polyMesh/neighbour
Total cell volume inside the box A: 4.0746335288354696e-07
Total cell volume  inside the box B: 2.966701578686209e-08
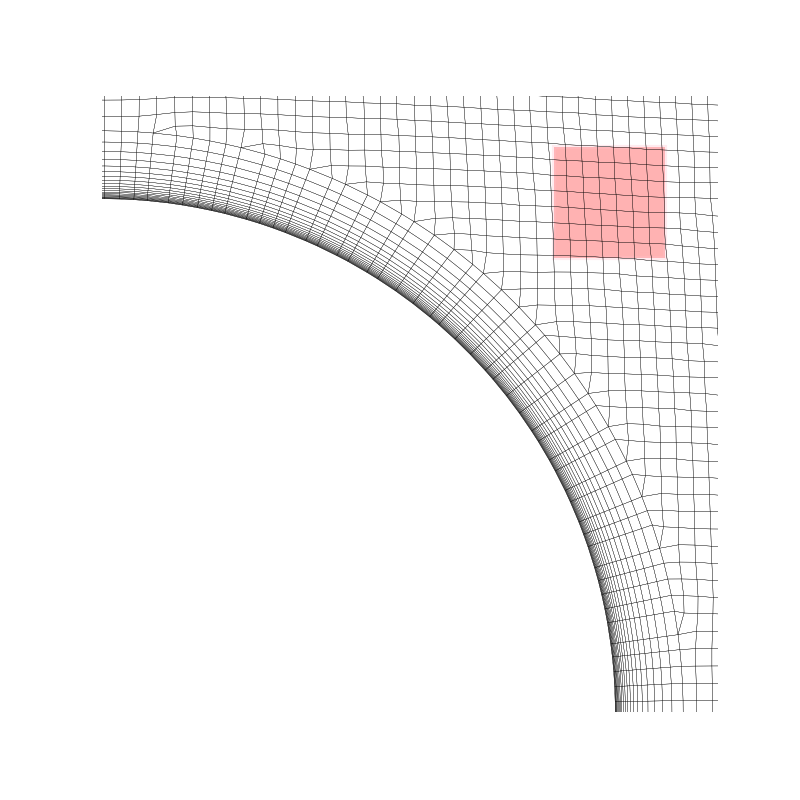
Visualisation of the two boxes
myMesh.update_box(mybox_A)

import matplotlib.pyplot as plt
from  matplotlib.collections import LineCollection
from matplotlib.patches import Rectangle

fig, ax = plt.subplots( figsize = (8,8))

# create a collection with edges and print it
ln_coll = LineCollection(myMesh.get_all_edgesInBox(), linewidths = 0.20, colors = 'black')
ax.add_collection(ln_coll, autolim=True)

# Set box dimensions as the figures's limits
ax.set_xlim(myMesh.get_xlim())
ax.set_ylim(myMesh.get_ylim())

# Add rectangle to plot, which corresponds to box B
ax.add_patch(Rectangle((mybox_B[0][0], mybox_B[0][1]), mybox_B[1][0]-mybox_B[0][0], mybox_B[1][1]-mybox_B[0][1],
             edgecolor = 'pink',
             facecolor = 'red',
             alpha=0.3,
             fill=True,
             lw=3))


# to avoid distorting the mesh:
ax.set_aspect('equal')

# to don't print axis:
ax.axis('off')

# to save the figure in pdf or svg format, uncomment one of the following two lines:
# plt.savefig('./myCylinderCellVolumes.pdf', dpi=fig.dpi, transparent = True, bbox_inches = 'tight')
# plt.savefig('./myCylinderZomm.svg', dpi=fig.dpi, transparent = True, bbox_inches = 'tight')
(np.float64(0.0), np.float64(0.03), np.float64(0.0), np.float64(0.03))
Total running time of the script: (0 minutes 26.845 seconds)